The Prediction of my graph was way off from the start but once I started to understand the format of the graphs. The line itself was easier to understand for the next two predictions. They were off still but the comparison of my prediction and the actual data presents similar lines than the first prediction. The reason as to why they were off was because I did not have a clue as to what it may look like. I was frankly clueless so I drew a line that made sense at the time.
Now when I started to graph it, I had zeros that represents the time and elevation. I was starting at zero seconds and my distance was at zero. That is what the zeros stood for in the graphs below. It simply stood for before the skateboard was let go and before the clock was set to tick.
Now what is similar of the three graphs is that they all have a similar shapes in the beginning. The distance increases rapidly before starting to slow down. Eventually the graph reaches its maximum and then begins to decrease. They all have a maximum and a minimum but each has its own inputs and outputs. The three shows that the higher the elevation for the skateboard. The farther the skateboard will travel in return of higher elevation.
Now if you look at the graphs and notice that certain parts of the graphs increases exponentially but it has a reason. You will see it rise incredibly because the skateboard has the energy to travel uphill. But the more time we invest watching the video. The more the energy is being consumed to continue uphill. Now the other part where you see it rising exponentially is the part of the graph where the graph is going downhill. The reason it decreases exponentially is because it has now new energy forcing it to go downhill. But eventually it will lose the energy needed to continue on. Maybe because of the elevation downhill or the cracks on the pavement.
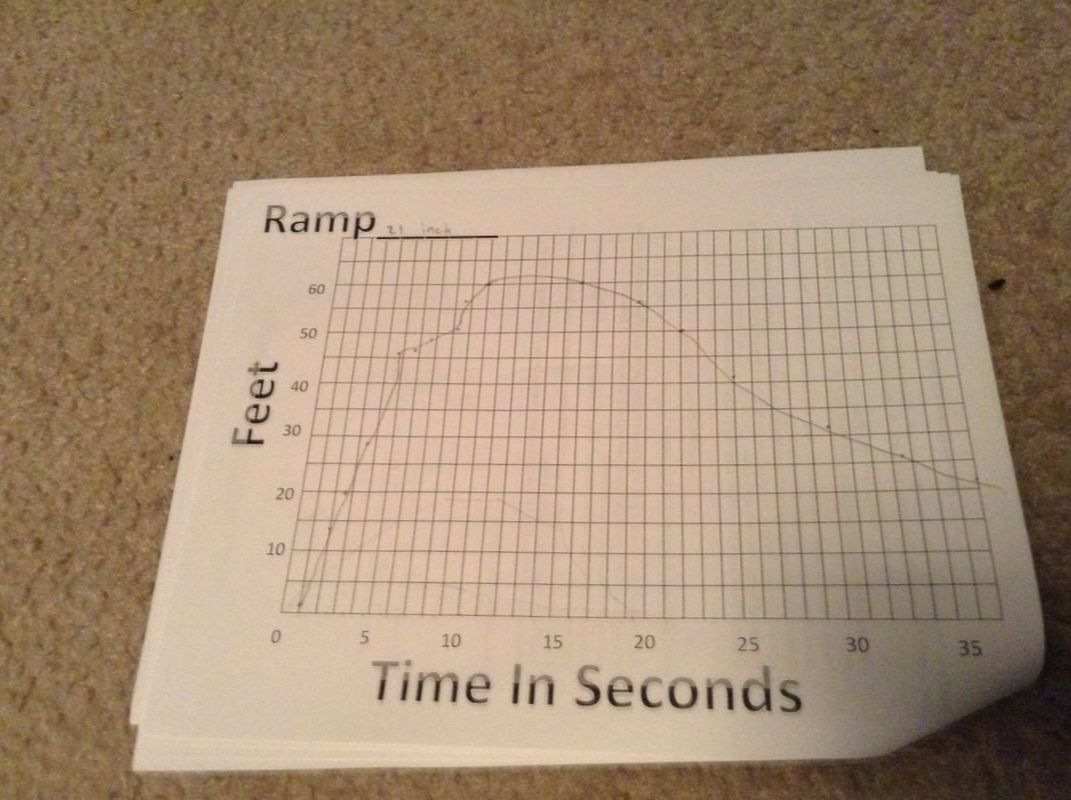 This first photo shows the first prediction of the skateboard with an elevation of 21 inches. I was completely off by a lot. | 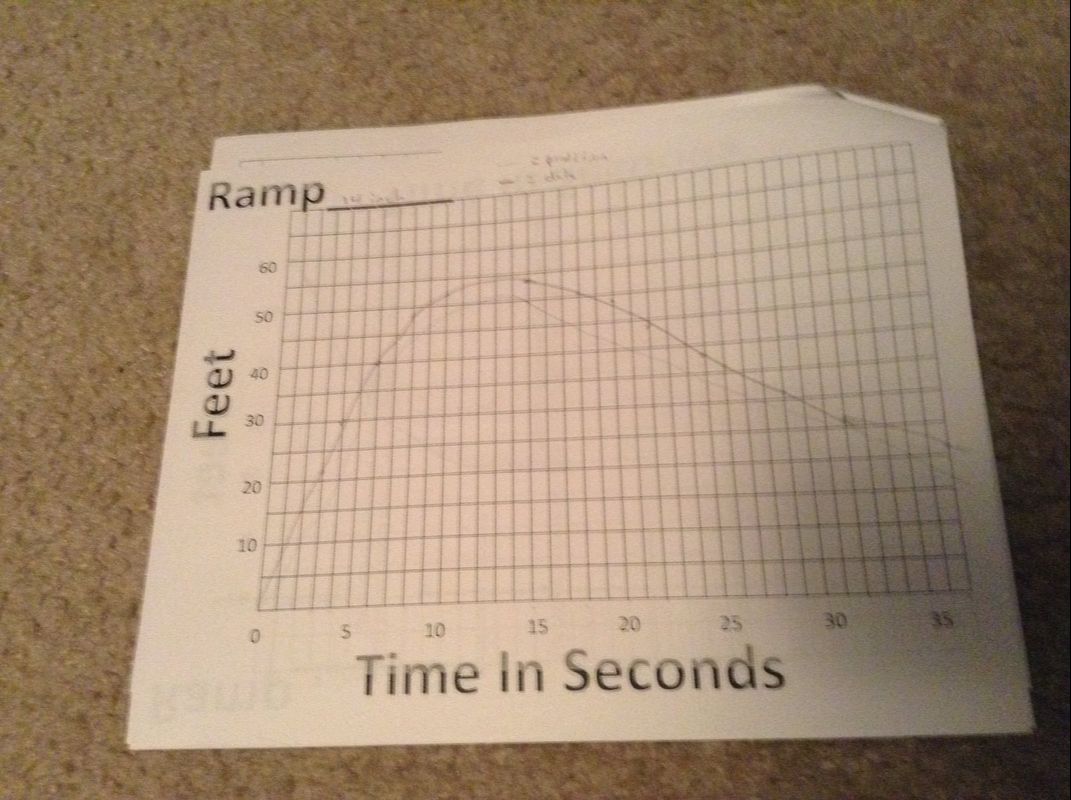 This second photo shows a better grasp of the prediction and is somewhat closer than the first prediction. This was the 14 inch elevation. | 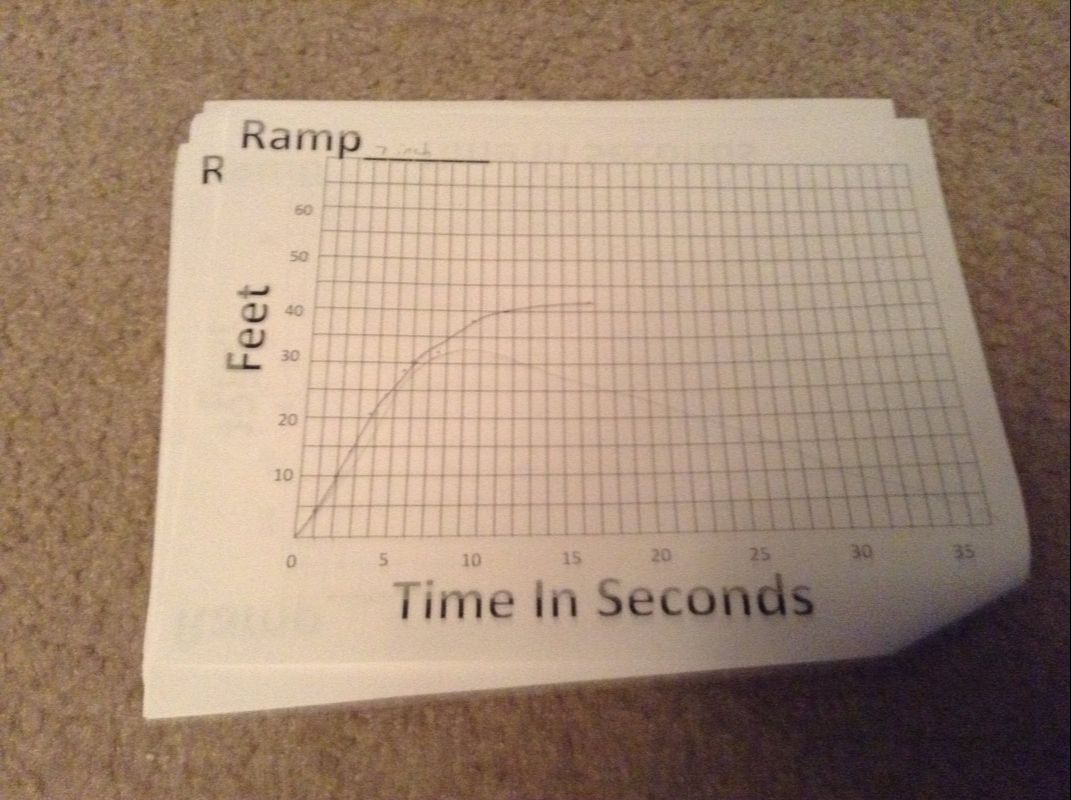 This third photo shows my third and last prediction which shows better results than the last two. But this was the 7 inch elevation graph. For this one in particular I had a better clue than the other two from observing closely. |
 RSS Feed
